.png)
Measurement-Based Care: Enable and Select Measures
PracticeQ's Measurement-Based Care feature makes it easy to track assessment scores over time.
When you incorporate Measurement-Based Care into your practice, you gain valuable insights into treatment effectiveness, allowing you to tailor interventions and optimize patient care for your clients.
We strongly recommend using Measurement-Based Care for Intake Forms only, NOT for Treatment Notes.
Measurement-Based Care questions should NOT have the Pinned Notes option enabled. Pinning a Measurement-Based Care question will prevent the score from updating in the patient chart with subsequent submissions.
Enable the Measurement-Based Care Feature
- Click More → Settings.
- Select the Features tab on the left.
- Scroll down to the Measurement-Based Care heading and click the Enable Scored Assessments button.

Select Measures
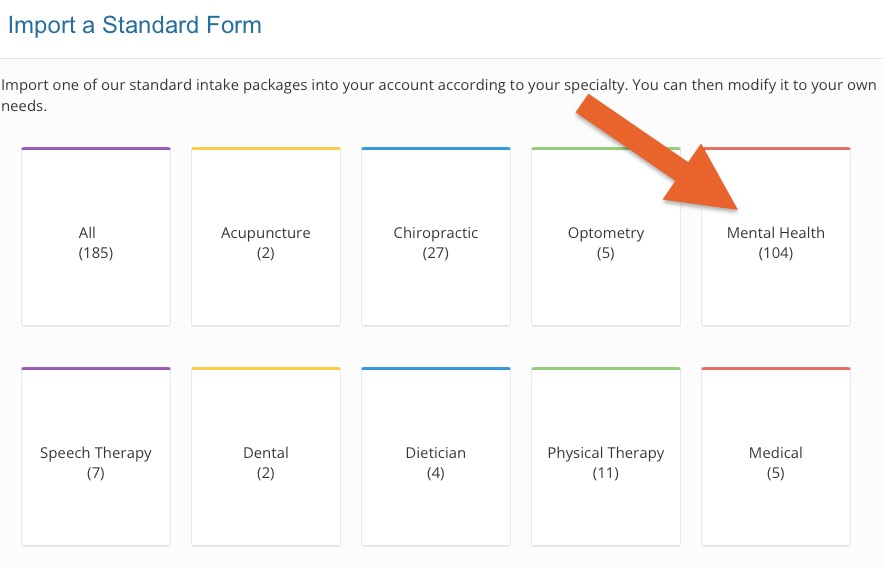
If you do not already have a library of measures and intakes in your account, you can import them from PracticeQ's collection.
- Click My Forms.
- Click the Standard Forms button on the top right corner.
- Select the Mental Health category.
- When the list of measured assessments displays, click to Preview and then Import the forms you need.

If you do not see the measure you need, read the following article for guidance: How Do I Convert a Paper Form to an Online Intake Form?
